Death by thousands partial views
- Posted in:
- Web dev
IMPORTANT UPDATE:
It seems I was wrong all the time! Lot of partial views WILL NOT slow down page rendering!
Profiling tools you use can slow down the application! After I disabled Glimpse, time-to-first-byte in Chrome was the same, in optimized version with 10 partial views, as in version with 182 partial views! It seems Glimpse injects some code into MVC execution pipeline to measure timings and who-knows-what, which introduces around 5-10ms per view call.
There’s no simple and quick “turbo button” for you application, unfortunately![]() But you need to learn how to use development tools, and how to read the results. The devil is in details.
But you need to learn how to use development tools, and how to read the results. The devil is in details.
The old blog post, if you’re interested:
Here goes a quick advice how to speed up performance of your website, at least Time-to-first-byte!
I had a performance problem with one e-commerce web site, where visitor needed to wait at least 5 seconds to see the web page. There were some changes with database server, so my first assumption was the speed of new server.
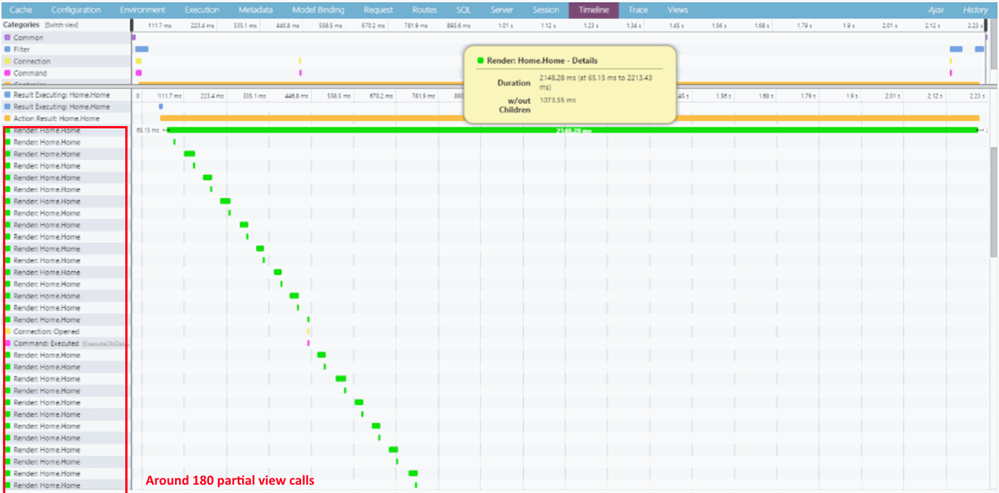
But to verify that, I had to profile page rendering pipeline. The easiest way is installation of Glimpse plugin, with EF add-on. After doing that, to my surprise, I saw database takes less than 10ms to return the results, so the devil has to be somewhere else! Going through glimpse Tab, I noticed this horror (here's just the part that fitted into my screen):
There were than 180 partial view calls from main page (remember, it's an e-commerce web site, each partial view renders one product. There are 9 categories with 9 products each rendered on the home page, and each product partial view calls another partial view to show some additional information – total of 182 views rendered)! And that took at least 80% of the whole rendering time for that page!
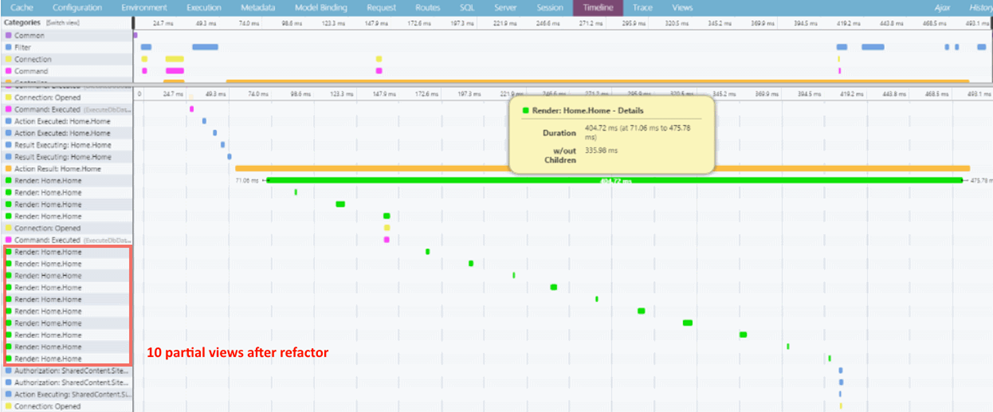
Now when I knew what's the problem, solution was easy, refactor of few Razor views, and rendering time went from 5-10 secs to under 1 second (on my local box went from 2+ secs to around 400ms, on remote VM from 5-10 secs to less than 1 sec). All done by simply reducing number of partial view calls from 180 to 10.
Side note; it makes code uglier, since I don’t have nice encapsulation of each partial view, than can be called from different places, but rather duplicated code in few Razor files. But the business value here is obvious! From development perspective, each duplicated content is well marked with code comments, so when someone modifies the code in one place, he/she will know that code needs to be copied to another location.
Nice, small and quick optimisation! MVC version I’m using is 5.2.3, but in v6 we can expect some major performance improvements of Razor view engine, so can’t wait to revisit this little test in about half year!
Moral point of the story; measure first, then fix! And definitely use Glimpse if doing any ASP.NET MVC work, it can save you hours of investigation!

